
Overview
Getting Started
Clusters
PMK CLI
APIs
Catapult Remote Monitoring
Platform9 Managed Add-ons
Platform Administration
Workloads & Apps
Support
Powered By

How to change between different dashboards in Grafana
Monitoring is preloaded with three sets of Kubernetes focused dashboards.
Node
Cluster
Kubernetes
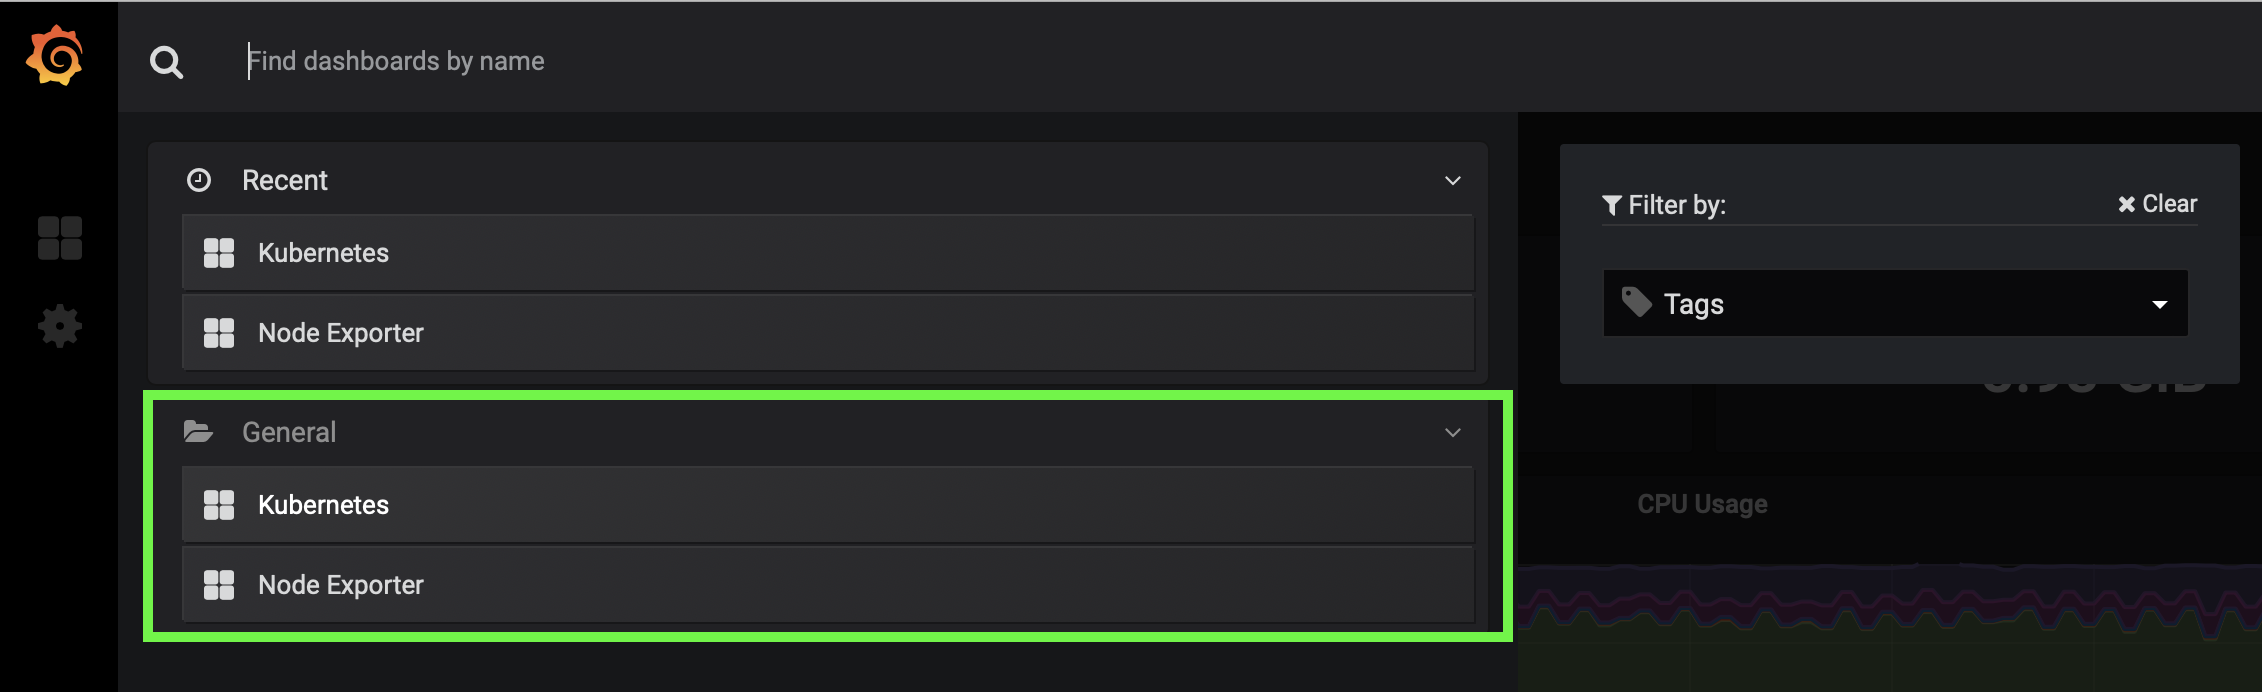
To change dashboards click the icon with four squares in the top right-hand corner of the dashboards.

Once expanded you are able to navigate to one of the alternative preloaded dashboards.
Was this page helpful?