Overview
Getting Started
Clusters
PMK CLI
APIs
Catapult Remote Monitoring
Platform9 Managed Add-ons
Platform Administration
Workloads & Apps
Support
Powered By
There are two ways to launch the Grafana dashboard for an individual cluster, either from the main Clusters view on the Infrastructure page or from the Cluster’s Details page.
To open Grafana from the main Clusters view, simply click the Grafana icon in the Links column of the Clusters table. If Links isn’t visible, click the gear icon to edit the column layout.
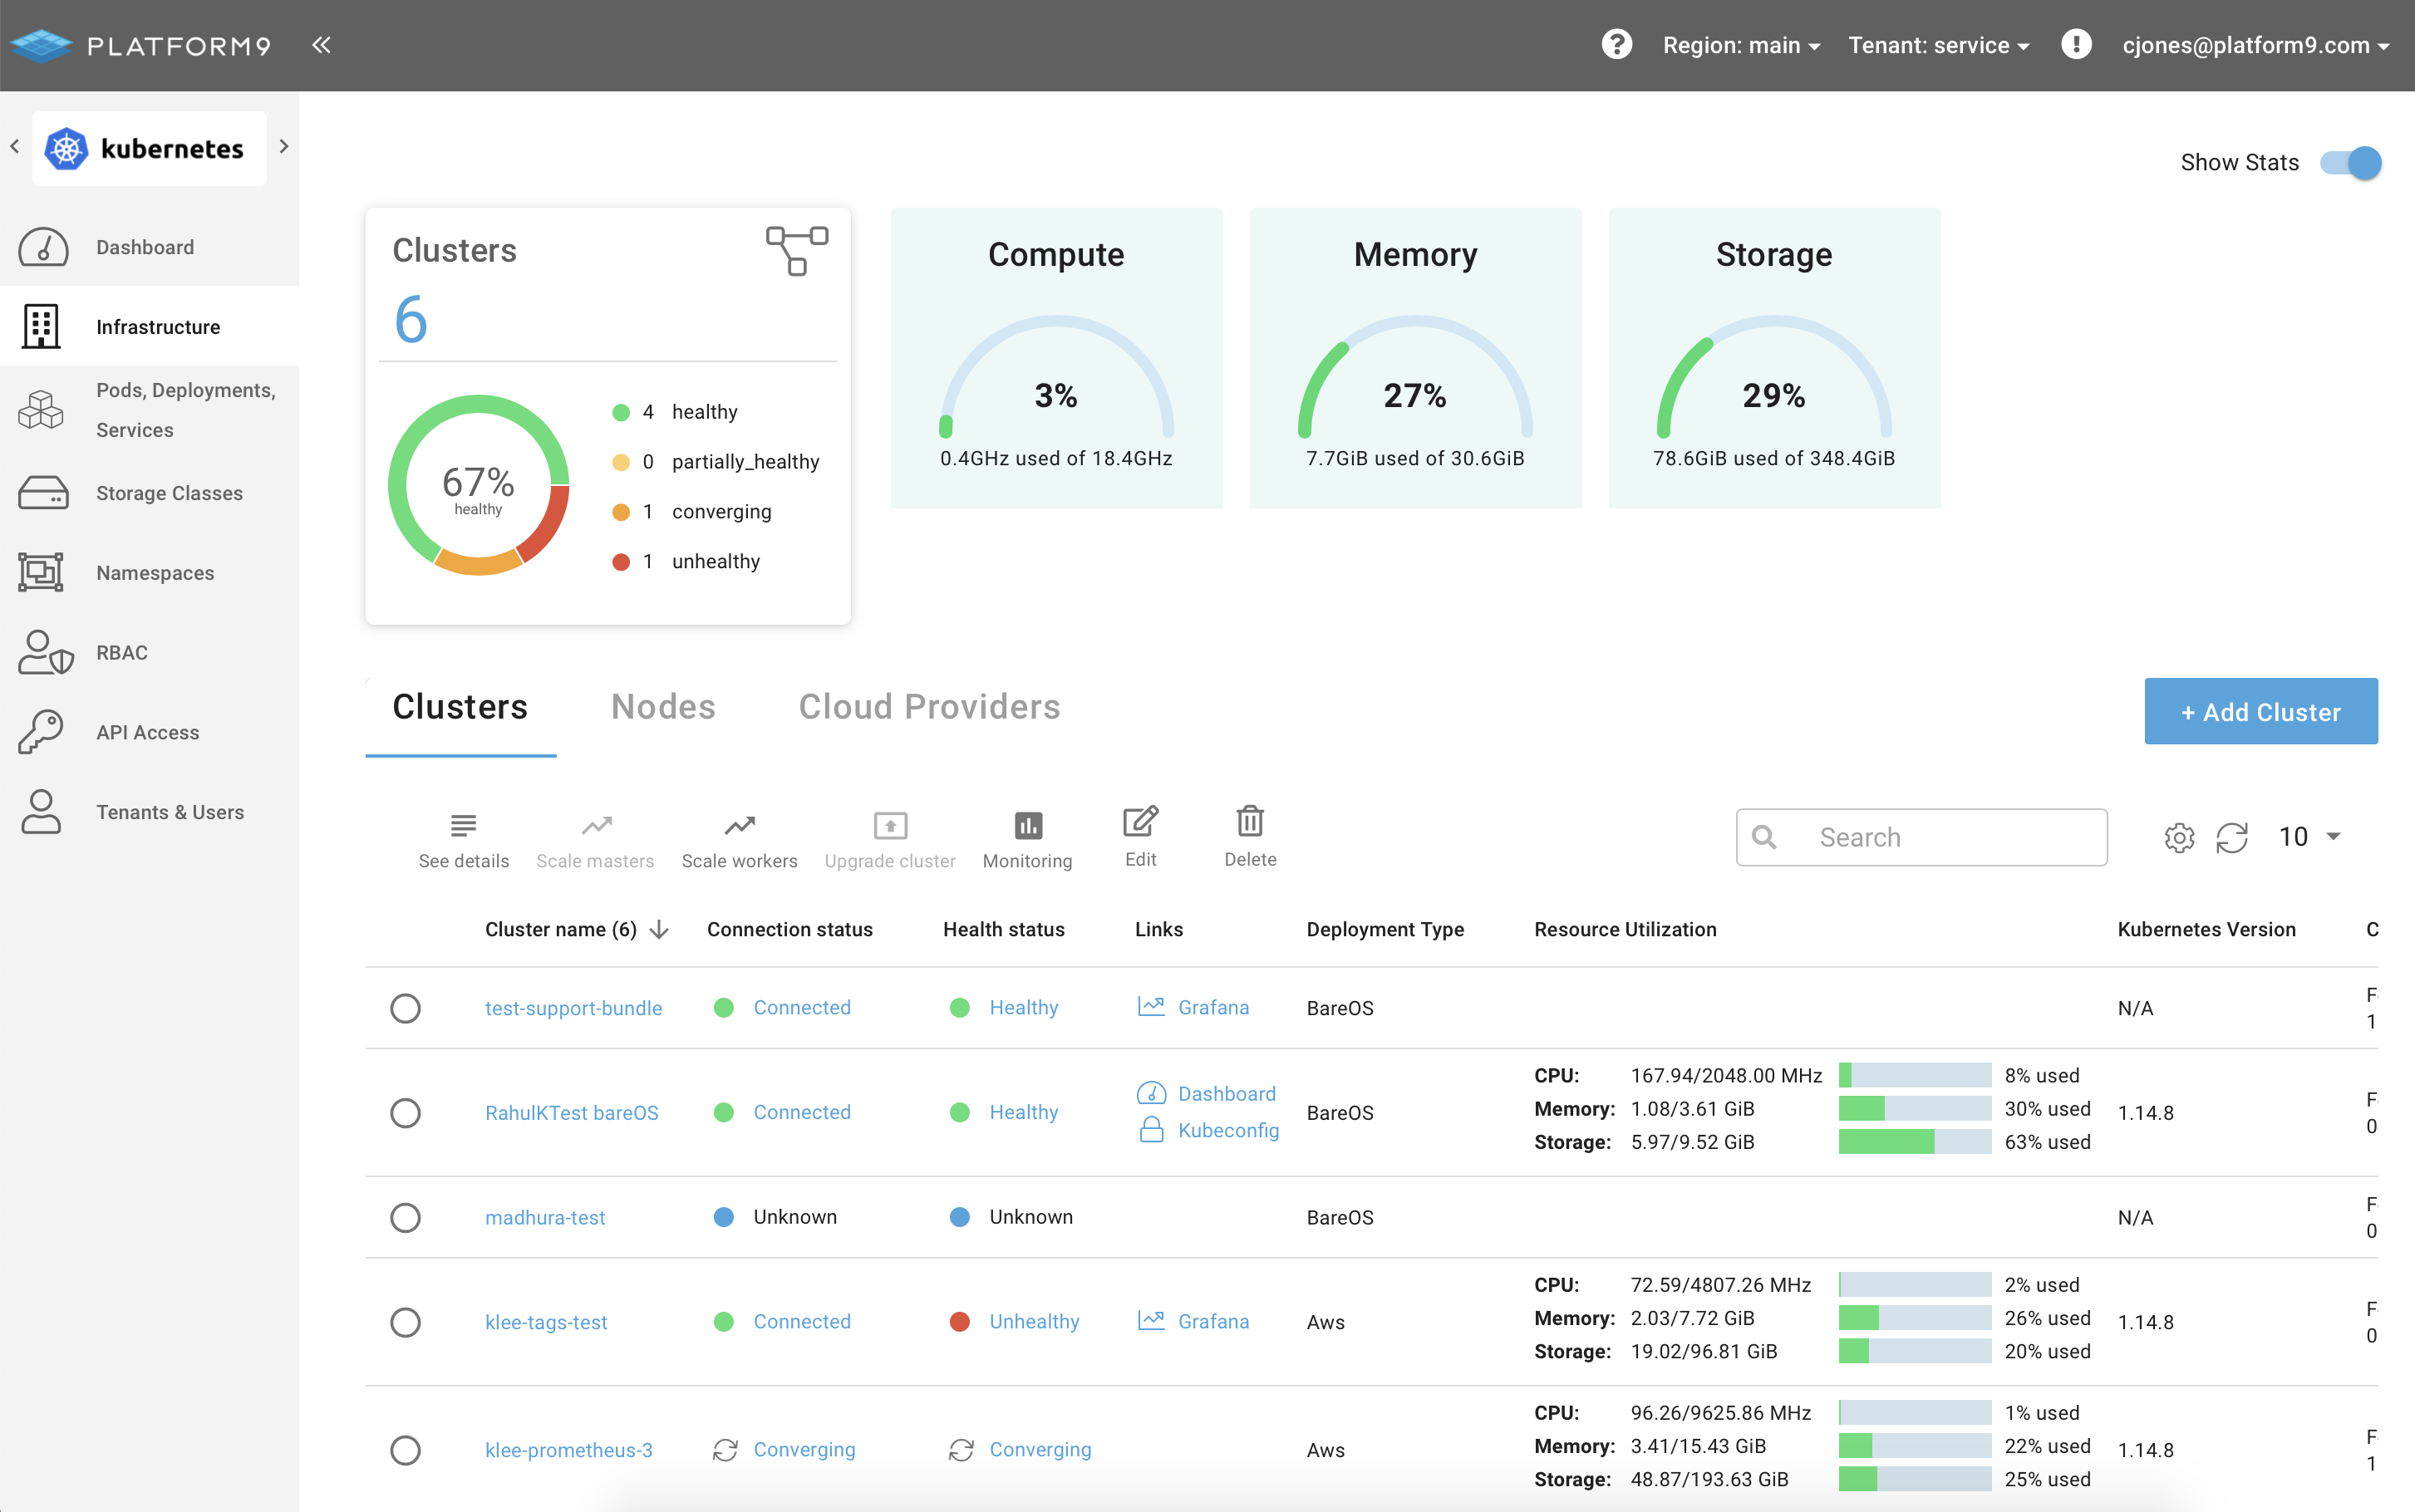
To open Grafana from the Clusters Details page click the link in the Cluster overview tile.
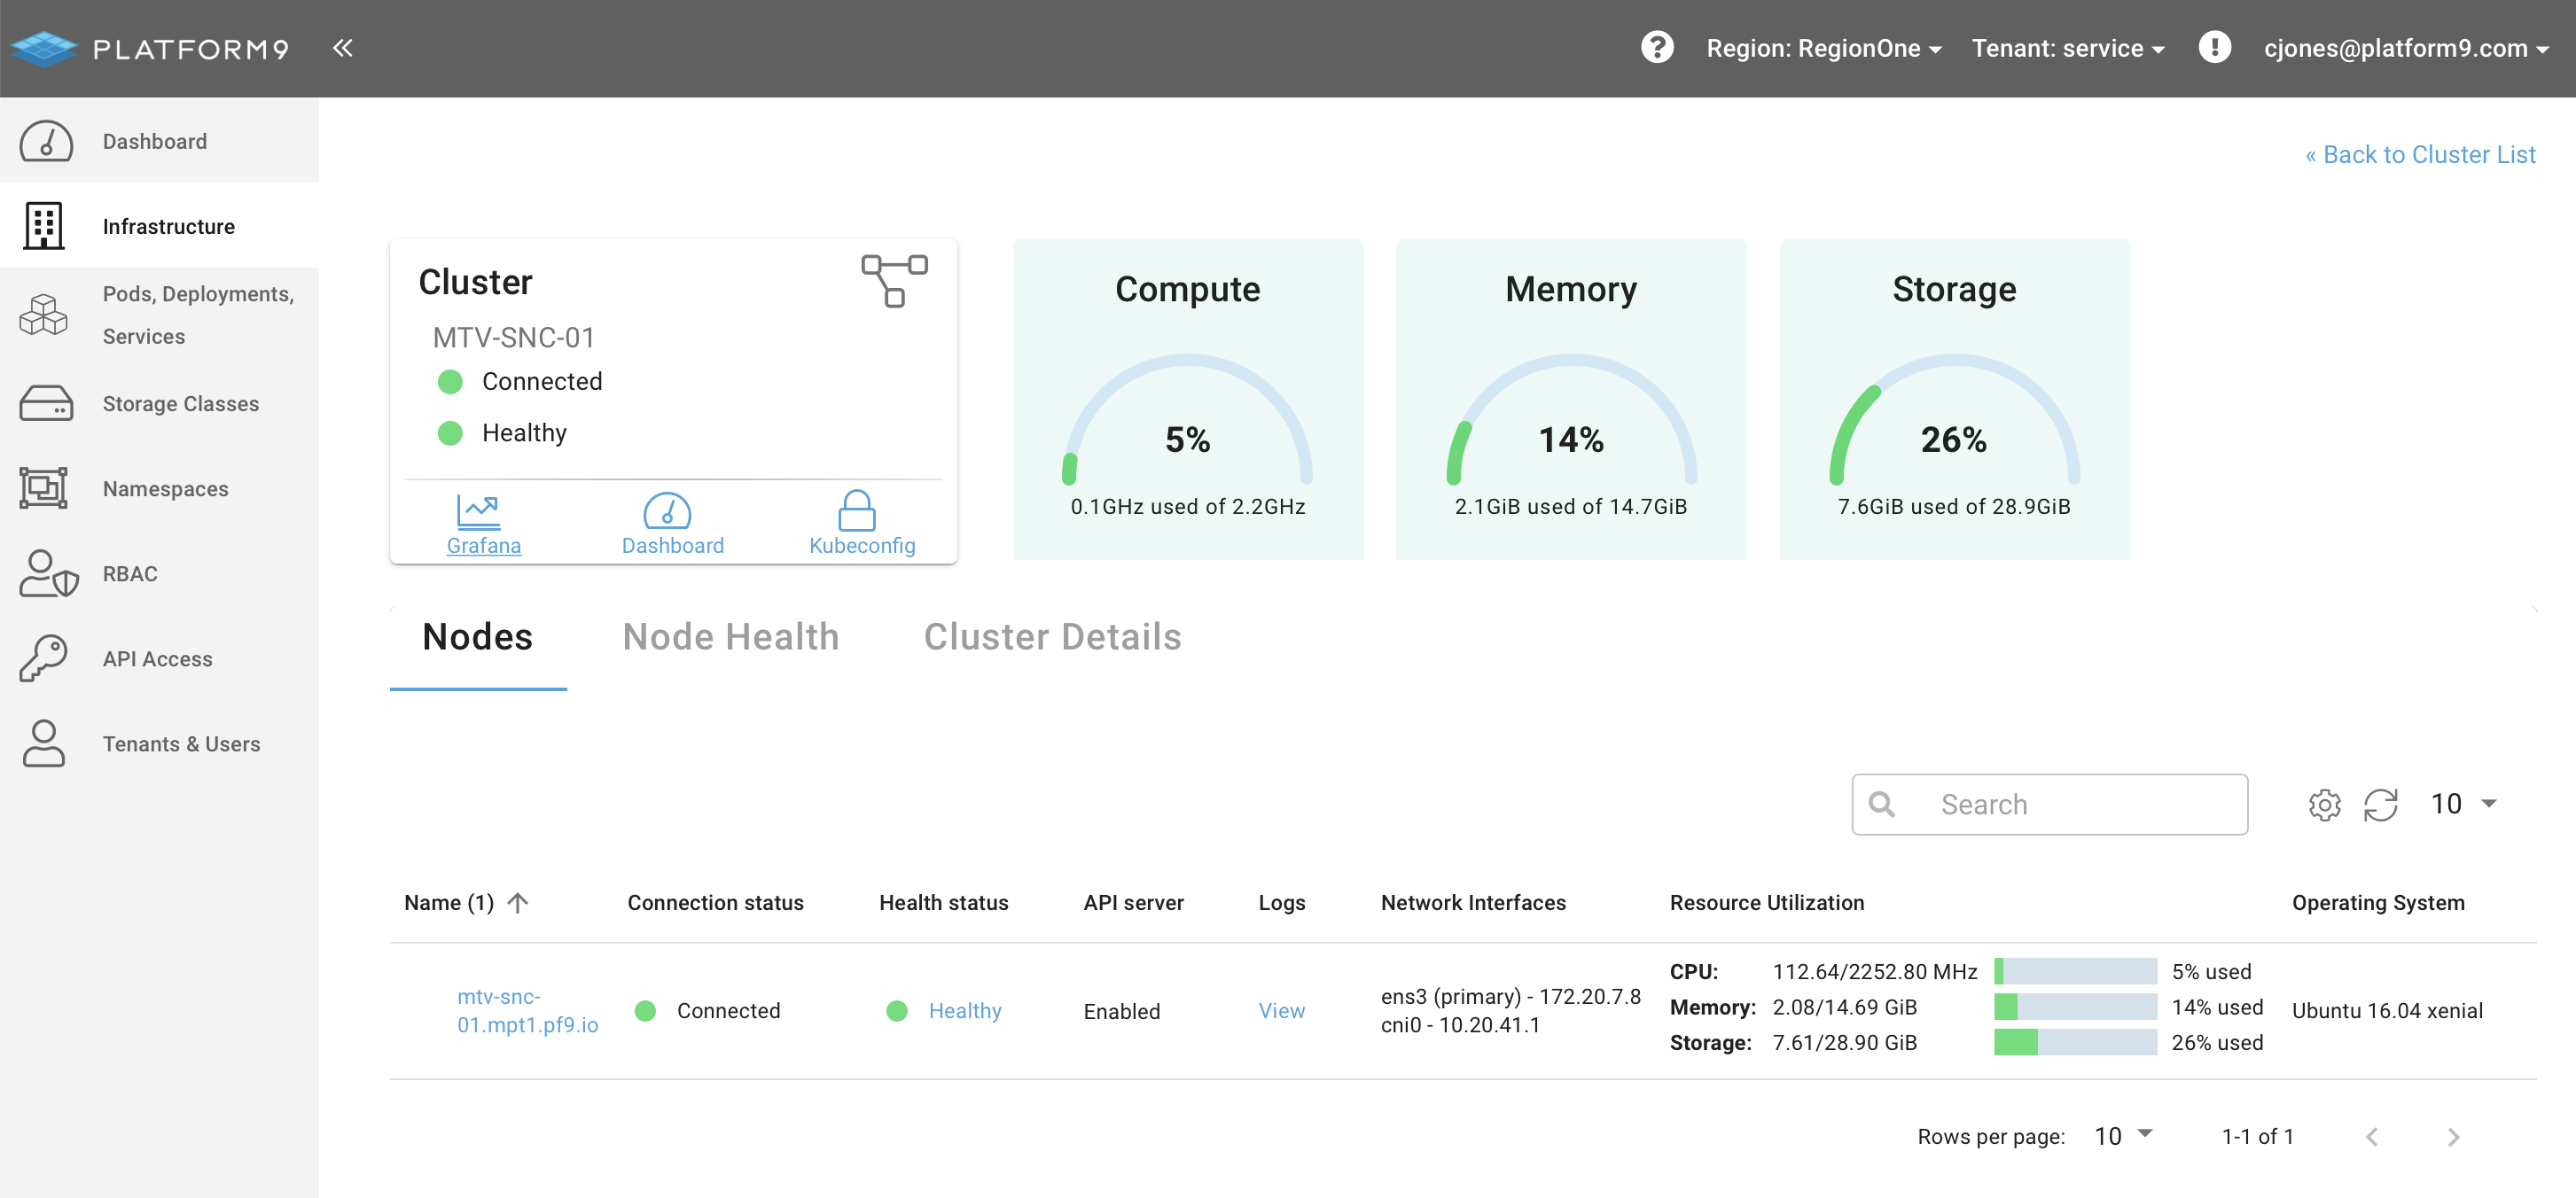
Once launched Platform9 will proxy a secure connection to the Monitoring deployment and load the Grafana dashboard for the selected cluster.

For further details, see Enable In-Cluster Monitoring.
Was this page helpful?